Driver Trees
What?
So I work in a company that, at its core, moves boxes. Put really simply, this means box-in, box-store, box-out style of company, similar to say Amazon. Oh and there’s a Private Equity company sitting on top of it all.
On a geographical map, the box in, box out paradigm works as a handful of Central Distribution centers (the parent if you will) with satellite branches (the child in a parent-child type relationship) to expand the delivery footprint. Each of these satellite branch structures has quite a hierarchical management structure through to a single branch manager. To assist the branch manager, there are several teams responsible for completing various tasks affiliated with Box in, Box store and Box out steps.
One of the core operational metrics of this style of companies is delivery performance of a customer order. Counted as a percentage of deliveries in full, on time (DIFOT for short).
Who does it help?
While putting in a new reporting system, it occurred to me that the average branch manager has way too many metrics on his plate. Serviced dutifully ‘from above’ with several stats for the past day or week, such as, Pick stats, Putaway stats, backorder counts, stock forecasting, EDI failure stats, carrier performance and more. All contributing in some way shape or form to the delivery performance of a customer order.
The statistics pinpoint the objective performance of some part of the box-in, box-out process or people, but no clear way to determine why a delivery performance number is what it is. To the uninitiated, these statistics do not derive one discreet action, they derive many. So which one is the metric the poor Branch Manager needs to action?
So what’s the problem again?
In a typical delivery failure, despite the granularity of information (yet still not enough!), there’s no structure to determine what truly contributed to a low on time deliveries (or low DIFOT), let alone action the appropriate metric. The more experienced of the branch managers will typically know through past experience to look for the metric that is ‘most likely’ to be indicator of the cause, and often they are correct. While this is usually efficient, it isn’t necessarily a consistent, sustainable, reportable, proactive or scalable approach. New branch managers tend to find out the hard way, perhaps if they’re lucky they can rely on an experienced 2nd In Charge, if one exists. This approach lends itself to perpetuating bad habits, and eventually produces an inconsistent, unsustainable, un-reportable, reactive and/or un-scalable approach…
The more experienced you were, the better you were at determining where the issue was. Did something go wrong at Box in, Box out, or something in between?
So how can Driver Trees help?
It occurred to me during my time as a Reporting team lead that the metrics were leading to paralysis by analysis. Perhaps Driver Trees could hold the key. Restrictively, there wasn’t very much practical information about driver trees. While the need for it where I work was immense…
I hear the echo of a quote from Atari’s inventor, Nolan Bushnell, which goes along the lines of:
“the best things are Easy to learn, hard to master”.
Perhaps this appealed to me because I used to play too many video games as a child, but the sentiment can be carried over…
Just tell me how it works…
While many KPIs can be considered important, given a particular context, it’s difficult to ascertain which KPI (or set of KPIs) can be of value to a particular problem. As a result, KPI Driver Trees may provide the solution to focus a user, given a particular process or context, to the right metrics.
KPI Driver Tree is representative of a ‘tree’ of metrics that affects the value of the top level metric given a particular context. This does not necessarily mean a formulaic representation of the metric – although, in some cases it could. The intent for the KPI Driver Tree is to illustrate the main ‘levers’ that contribute to produce a particular (good or bad) outcome. KPI drivers are commonly defined at a level of detail consistent with the decision variables that are under the control of line management. This means that levels of metrics are required to determine the actionable metrics that contribute to a single, top-level, strategic metric.
To achieve this and ensure the metrics are actionable, KPI Driver Trees should be focused on the process rather than the formula behind the metric. This allows the appropriate levers to be relevant for a particular role. This in turn will allow actionable lower level metrics that can be abstracted to the top level.
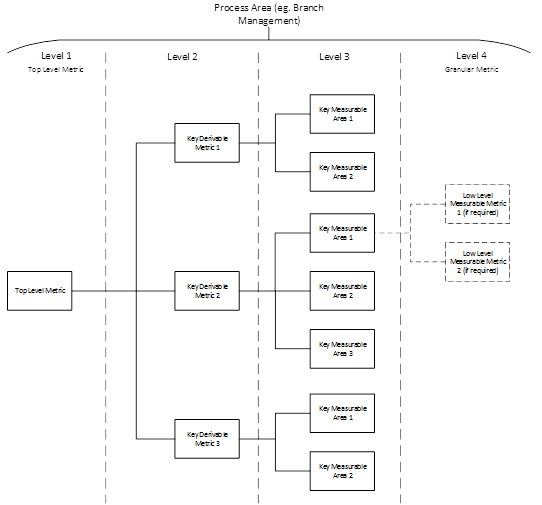
Note the following diagram:

The top level of the driver trees is representative of a key strategic metric (e.g. DIFOT). The next level of the driver tree is composed of metrics that derive the top level metric – in a particular context or process. The following level are the key measurable Metrics that contribute to the metric in the previous level (Note: Level 2 and Level 3 could both be measurable – this is subject to the complexity of the top level metric and/or the process).
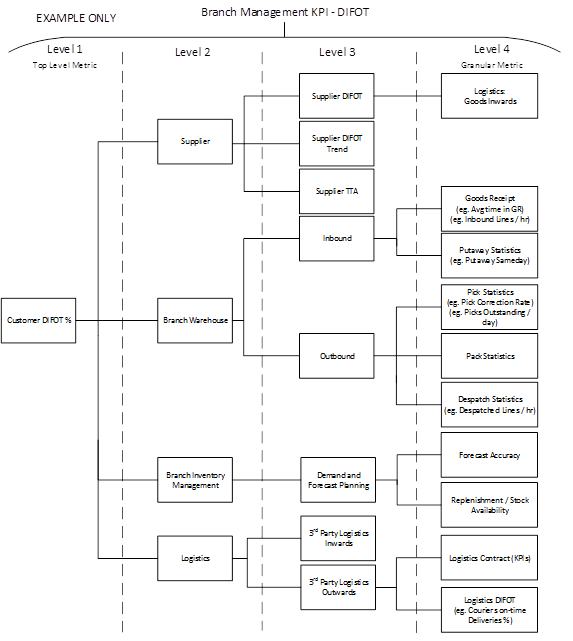
Here is an example of a driver tree for DIFOT. The top level in this KPI driver tree is DIFOT. In the context of branch operations, this metric is derived partly from Supplier performance, a branch’s Warehouse operations, a branch’s Inventory Management and Logistics performance (inwards or outwards).

So in conclusion…
Driver trees are only part of the formula. You need to have ensured that the metrics you’re using are relevant in the first place. Perhaps through a Top Down requirements gathering approach to provide a baseline against clearly defined process areas (another pre-requisite).
In conjunction with a key business process or context, (in this example, the process of Branch Management) and using the baselined “Top Level” metrics (for example, DIFOT) allows KPI Driver trees that provide the right actionable metrics which are consistent, sustainable, reportable, proactive and scalable!
Happy days!
Cheers,
garagisti